

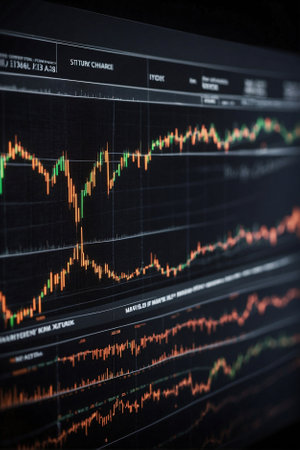
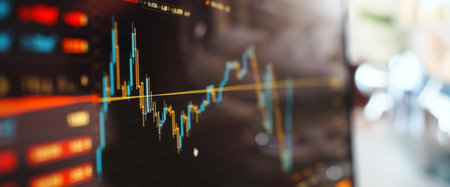
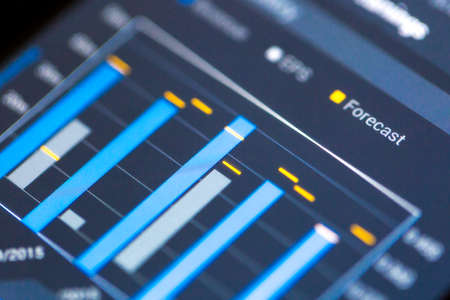
Shallow depth of field (selective focus) with details of a chart showing the stock market crash from March 2020 due to the Covid-19 pandemic on a computer screen (S&P500 index)
Коллекция по умолчанию
Коллекция по умолчанию
Создать новую
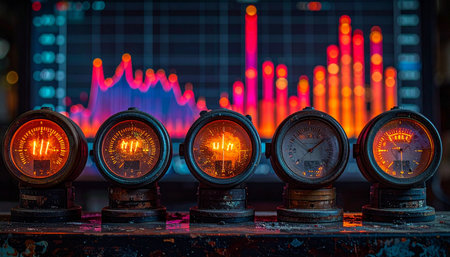
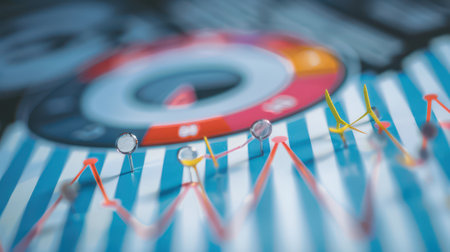
A row of vintage industrial gauges glows with warm intensity, actively monitoring the volatile fluctuations of a complex data chart displayed in the background.
Коллекция по умолчанию
Коллекция по умолчанию
Создать новую
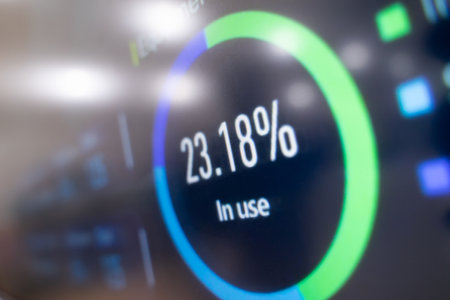
Fitness machine display sport exercise workout effectiveness, macro view.
Коллекция по умолчанию
Коллекция по умолчанию
Создать новую

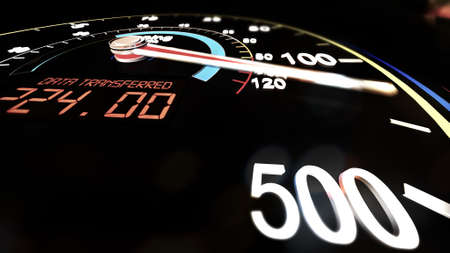
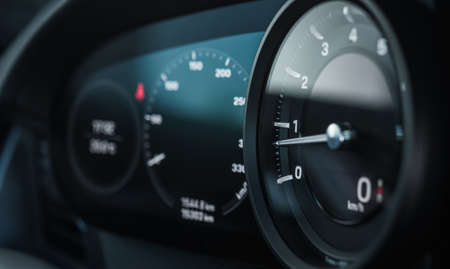
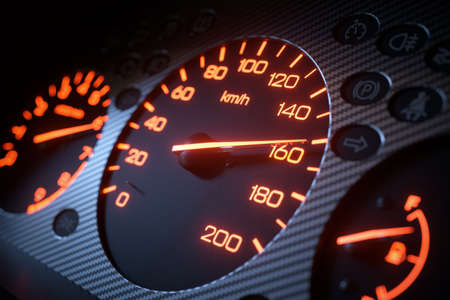
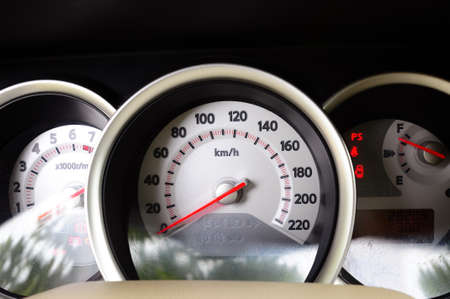
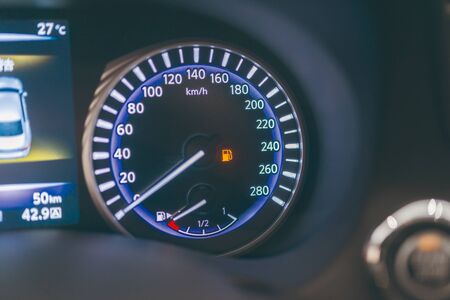
Close up shot with the digital speedometer of a car.
Коллекция по умолчанию
Коллекция по умолчанию
Создать новую

Candle stick graph chart with indicator showing bullish point or bearish point, up trend or down trend of price of stock market or stock exchange trading, investment and financial concept.
Коллекция по умолчанию
Коллекция по умолчанию
Создать новую
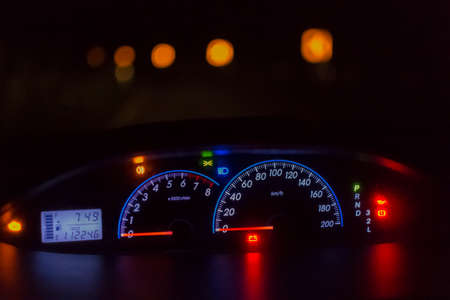
Car dashboard with lit speedometer and tachometer in factory setting
Коллекция по умолчанию
Коллекция по умолчанию
Создать новую

Financial instruments with various types of indicators including volume analysis for professional technical analysis
Коллекция по умолчанию
Коллекция по умолчанию
Создать новую
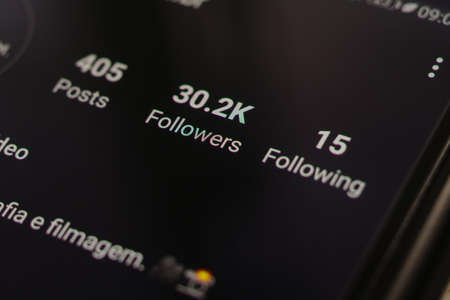
Kuala Lumpur, Malaysia, 24th July 2020: Close up Instagram application menu on smartphone screen. Instagram is a photo and video-sharing social networking service owned by Facebook.
Коллекция по умолчанию
Коллекция по умолчанию
Создать новую

Wooden cubes in a scale with a measuring arrow, showing changes from red to green level on blue paper background
Коллекция по умолчанию
Коллекция по умолчанию
Создать новую

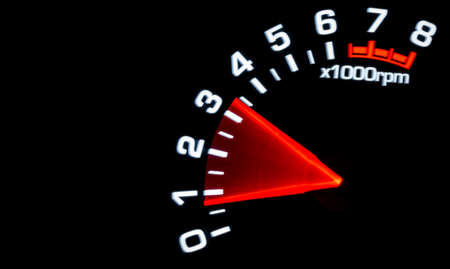
Rpm car odometer detail symbol of power and speed
Коллекция по умолчанию
Коллекция по умолчанию
Создать новую
Loading progress bar Load or download and upload circle and speed loader icon. Status or loader progress percentage bar for website or internet page in neon gradient.
Коллекция по умолчанию
Коллекция по умолчанию
Создать новую
Internet Bandwidth Download Upload Speed Meter 3D Illustration
Коллекция по умолчанию
Коллекция по умолчанию
Создать новую
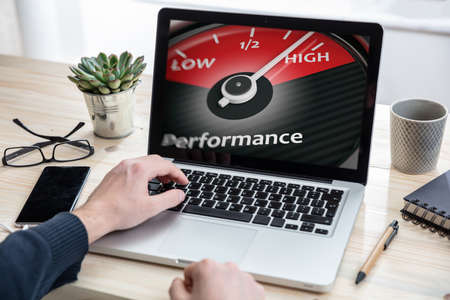
High performance concept. Man working with a computer, performance gauge speedometer on the screen, office background.
Коллекция по умолчанию
Коллекция по умолчанию
Создать новую

A stock market graph on a black background.
Коллекция по умолчанию
Коллекция по умолчанию
Создать новую
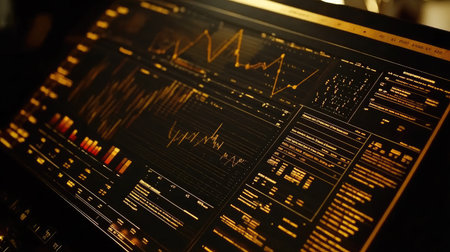
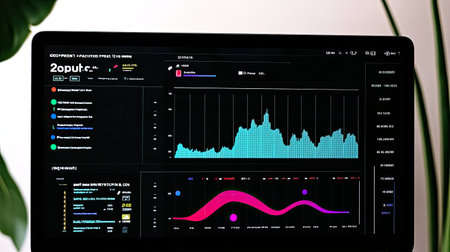
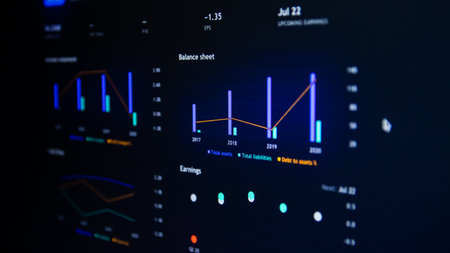
Close-up of a sophisticated data visualization dashboard featuring various graphs and analytics for monitoring performance and trends in real-time.
Коллекция по умолчанию
Коллекция по умолчанию
Создать новую

Fitness machine display sport exercise workout effectiveness, macro view.
Коллекция по умолчанию
Коллекция по умолчанию
Создать новую
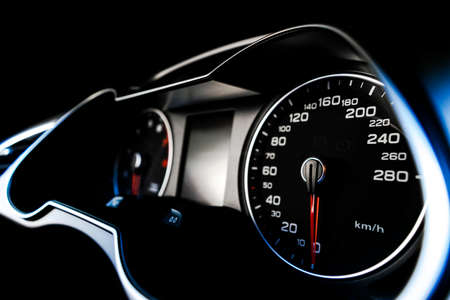
Rev Counter Tachometer Instrument in Modern Car Dashboard. Revolution-Counter Measuring Device. Automotive and Transportation Technology.
Коллекция по умолчанию
Коллекция по умолчанию
Создать новую
Business graph and trade monitor
Коллекция по умолчанию
Коллекция по умолчанию
Создать новую
Car dashboard lights and road background in the night.Close up.
Коллекция по умолчанию
Коллекция по умолчанию
Создать новую
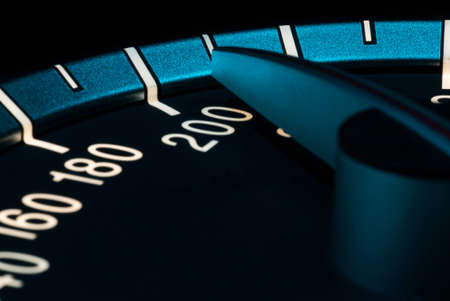
Speed detail with car odometer macro shot
Коллекция по умолчанию
Коллекция по умолчанию
Создать новую

Business financial or stock market background. Business graph on stock market financial exchange
Коллекция по умолчанию
Коллекция по умолчанию
Создать новую

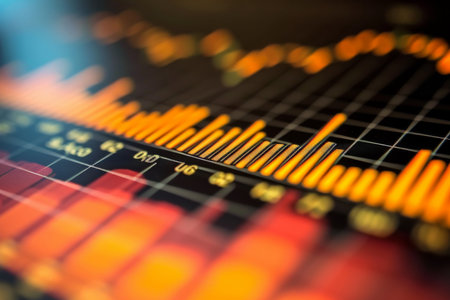
Financial stock market graph. Stock Exchange. Selective focus.
Коллекция по умолчанию
Коллекция по умолчанию
Создать новую
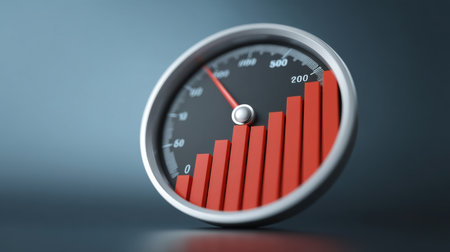
Dynamic representation of business growth with a red bar graph and speedometer showcasing performance metrics against a sleek dark background for visual impact.
Коллекция по умолчанию
Коллекция по умолчанию
Создать новую
View of Stock Market Crash from Covid-19 Pandemic with shallow depth of field.
Коллекция по умолчанию
Коллекция по умолчанию
Создать новую
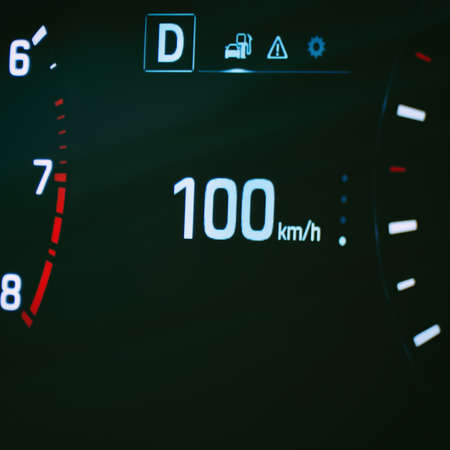
Speedometer in the car on the dashboard. The cars speedometer shows 100 mph
Коллекция по умолчанию
Коллекция по умолчанию
Создать новую

Car miles speedometer close up.
Коллекция по умолчанию
Коллекция по умолчанию
Создать новую
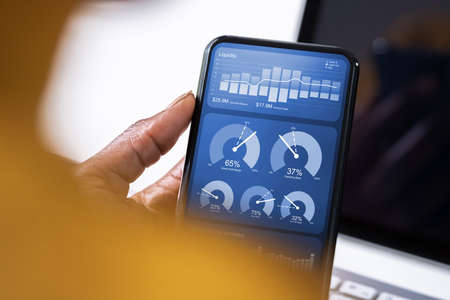
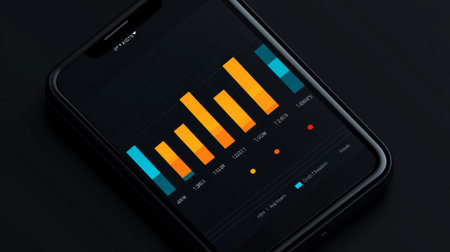
A sleek smartphone shows vibrant data charts and graphs against a dark background. The device captures attention with its user-friendly interface and illuminated ambiance.
Коллекция по умолчанию
Коллекция по умолчанию
Создать новую

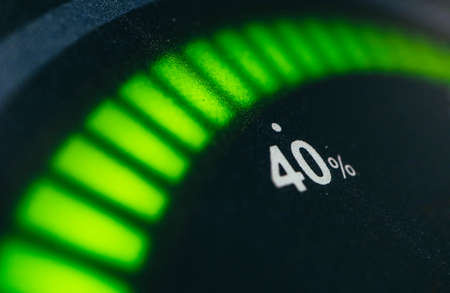
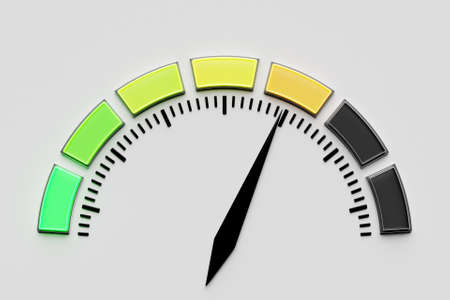
3d illustration control panel icon with indicator 10 . Low risk concept on speedometer. credit rating scale
Коллекция по умолчанию
Коллекция по умолчанию
Создать новую

Financial stock market graph. Stock Exchange. Selective focus.
Коллекция по умолчанию
Коллекция по умолчанию
Создать новую
African Advisor Using KPI Dashboard With Financial Analytics Graphs
Коллекция по умолчанию
Коллекция по умолчанию
Создать новую
Working set for analyzing financial statistics and analyzing a market data. Data analysis from charts and graphs
Коллекция по умолчанию
Коллекция по умолчанию
Создать новую
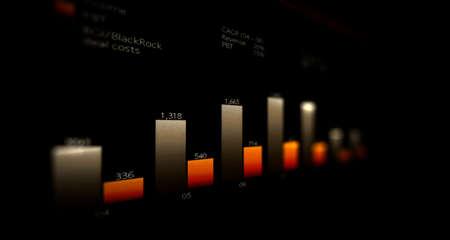
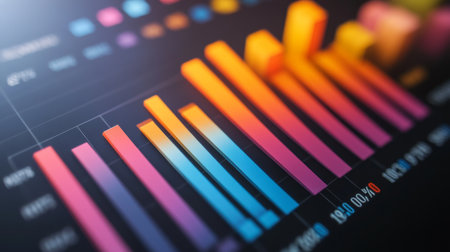
A colorful bar chart showing quarterly sales growth for a tech startup, with upward trends highlighted
Коллекция по умолчанию
Коллекция по умолчанию
Создать новую
3D illustration loading bar with an indicator in the middle in orange zone. Rings of Progress
Коллекция по умолчанию
Коллекция по умолчанию
Создать новую

Close up shot of an analog car volt meter.
Коллекция по умолчанию
Коллекция по умолчанию
Создать новую
A sleek digital dashboard showcasing market analysis with engaging charts. Ideal for professionals seeking insights into financial performance and trends.
Коллекция по умолчанию
Коллекция по умолчанию
Создать новую

Close up shot of a speedometer in a car, at night
Коллекция по умолчанию
Коллекция по умолчанию
Создать новую
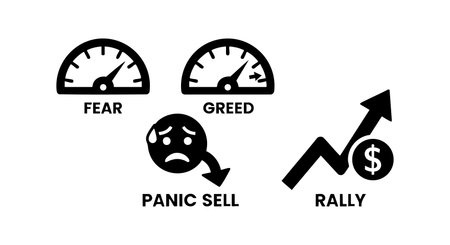
Vector illustration showing financial market concepts including fear, greed, panic sell, and rally with arrows and gauges representing market emotions and trends in a simple style calm
Коллекция по умолчанию
Коллекция по умолчанию
Создать новую

Stock market candlestick chart, asset prices movement, currency exchange price action simple concept. Computer screen, display, candle chart, graph detail, extreme closeup, nobody, no people
Коллекция по умолчанию
Коллекция по умолчанию
Создать новую
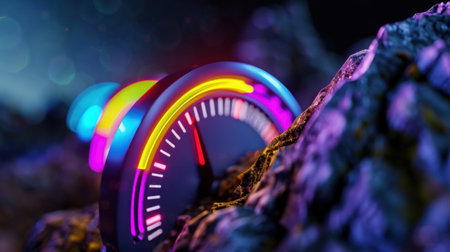
A mesmerizing close-up of vibrant speedometers with neon lights set against a rocky backdrop, creating a futuristic atmosphere filled with color and energy.
Коллекция по умолчанию
Коллекция по умолчанию
Создать новую
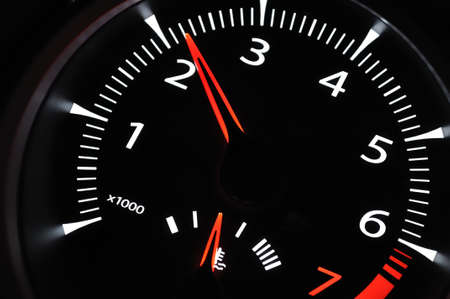
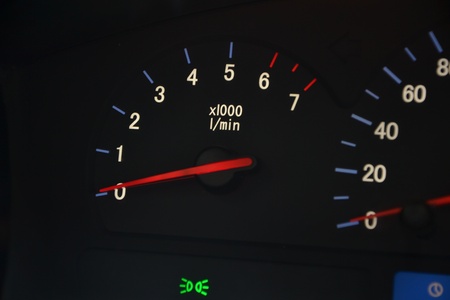
Close up shot of a tachometer in car. Car dashboard. Dashboard details with indication lamps.Car instrument panel. Dashboard with tachometer isolated on black.
Коллекция по умолчанию
Коллекция по умолчанию
Создать новую

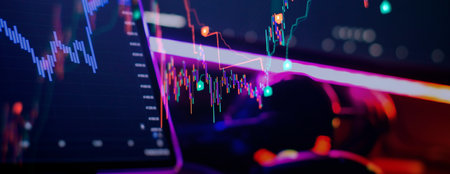
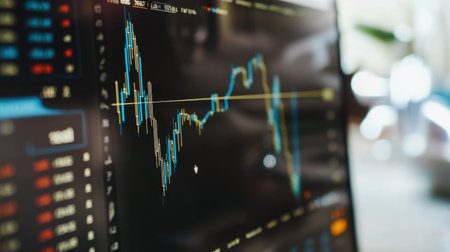
image of the financial graph on a computer monitor.
Коллекция по умолчанию
Коллекция по умолчанию
Создать новую
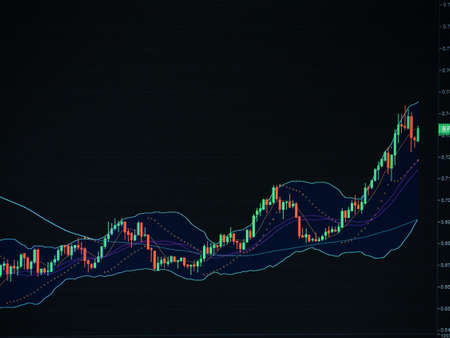
Business or Financial Reference: Displaying stock market data, stock exchange or chart on a monitor, stock market chart, stock exchange or chart. stock market investment trading chart.
Коллекция по умолчанию
Коллекция по умолчанию
Создать новую
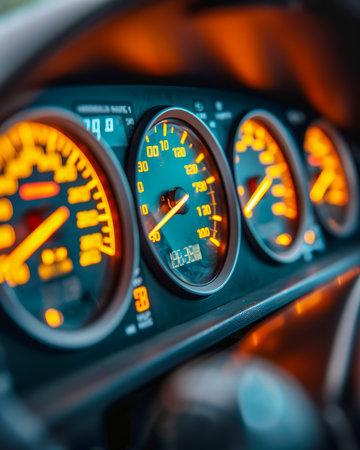
Close up View of Illuminated Car Dashboard Gauges with Focus on Speedometer and RPM Vehicle Interior Details in Warm Light AI Generative
Коллекция по умолчанию
Коллекция по умолчанию
Создать новую

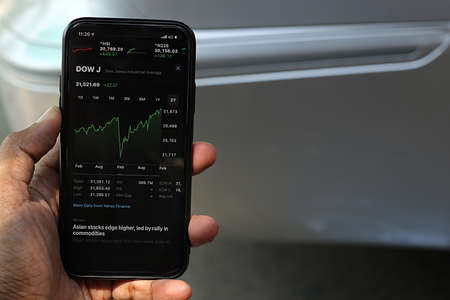
Trader investor broker holding finger using cell phone app executing financial stock trade market trading order to buy or sell
Коллекция по умолчанию
Коллекция по умолчанию
Создать новую

Customer feedback, service rating, satisfaction, customer experience concept. Evaluation for improvement product and service. Hand puts wooden cubes with emotions satisfaction meter icons.
Коллекция по умолчанию
Коллекция по умолчанию
Создать новую
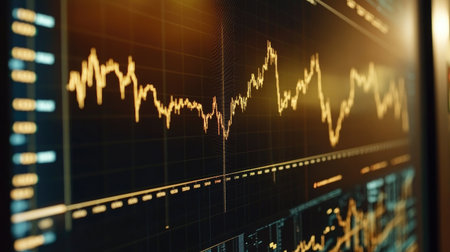
A vibrant image of a large monitor displaying a detailed gold price chart with various technical indicators and a prominent upward trend in gold prices.
Коллекция по умолчанию
Коллекция по умолчанию
Создать новую

A person in a suit holds out a hand presenting a digital KPI dashboard. This image represents business performance tracking, data analysis, and strategic goal achievement.
Коллекция по умолчанию
Коллекция по умолчанию
Создать новую
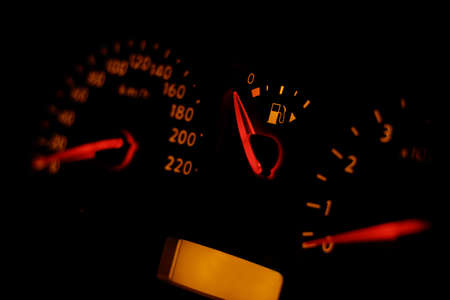
Close up shot of a speedometer in a car. Car dashboard. Dashboard details with indication lamps.Car instrument panel. Dashboard with speedometer, tachometer, odometer. Car detailing. Modern interior
Коллекция по умолчанию
Коллекция по умолчанию
Создать новую
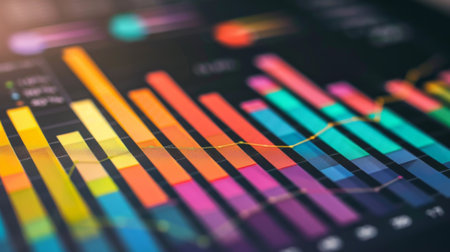
A 3D bar graph with data labels and percentage values displayed above each bar, providing a clear and informative business analysis
Коллекция по умолчанию
Коллекция по умолчанию
Создать новую
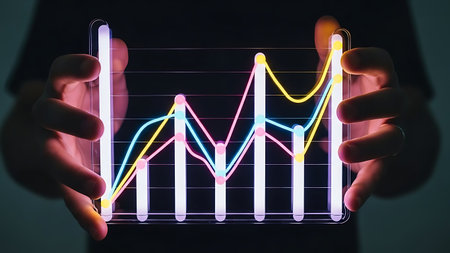
Hands Holding Glowing Digital Line Graph Chart
Коллекция по умолчанию
Коллекция по умолчанию
Создать новую
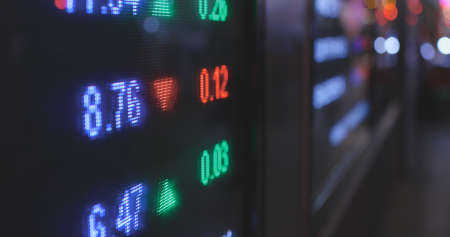
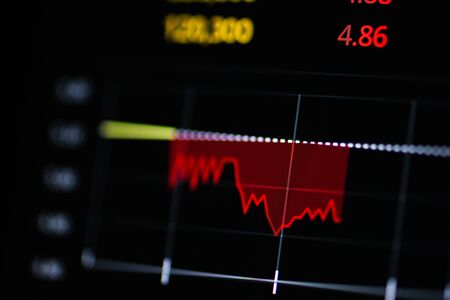
Stock market data display
Коллекция по умолчанию
Коллекция по умолчанию
Создать новую

The Stock Exchange, Streaming Trade Screen, The stock screen shows a list of stocks with reduced value.
Коллекция по умолчанию
Коллекция по умолчанию
Создать новую

decibel meter of a sound amplifier illuminated orange on black background
Коллекция по умолчанию
Коллекция по умолчанию
Создать новую
A close-up view of a digital sound mixer highlights green bars indicating audio levels and frequency visualization, showcasing modern sound technology.
Коллекция по умолчанию
Коллекция по умолчанию
Создать новую
car warning lights
Коллекция по умолчанию
Коллекция по умолчанию
Создать новую
Car dashboard with orange backlighting close up 3D render
Коллекция по умолчанию
Коллекция по умолчанию
Создать новую

Illuminated motorbike control panel with speedometer and revs counter
Коллекция по умолчанию
Коллекция по умолчанию
Создать новую
Business statistics and Analytics value. Abstract glowing forex chart interface background. Investment, trade, stock, finance and analysis concept.
Коллекция по умолчанию
Коллекция по умолчанию
Создать новую
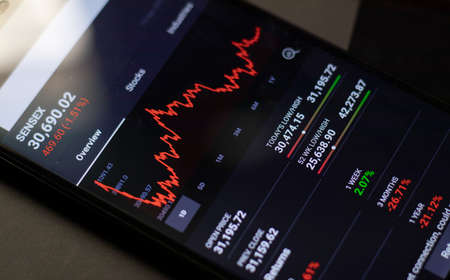
Maski, India - April 14, 2020 : Crash in sensex share market on mobile during covid-19 lockdown.
Коллекция по умолчанию
Коллекция по умолчанию
Создать новую

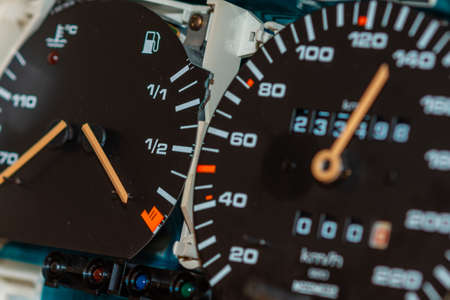
Close up shot of the dashboard a car.
Коллекция по умолчанию
Коллекция по умолчанию
Создать новую
Stock Market Chart on Dark Background: Financial Analytics. Digital Art: Modern Technologies
Коллекция по умолчанию
Коллекция по умолчанию
Создать новую

speedometer and dashboard car black and white photography
Коллекция по умолчанию
Коллекция по умолчанию
Создать новую
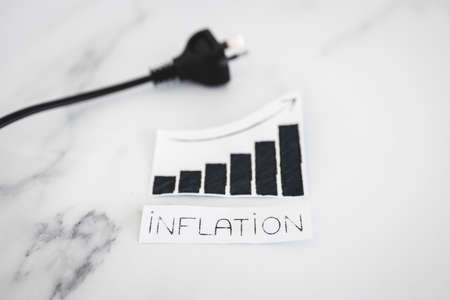
electricity costs going up ,conceptual image with plug nxt to stats graph showing prices going up
Коллекция по умолчанию
Коллекция по умолчанию
Создать новую
Car dashboard with backlight
Коллекция по умолчанию
Коллекция по умолчанию
Создать новую

Data analyzing in Forex, Commodities, Equities, Fixed Income and Emerging Markets: the charts and summary info show about Business statistics and Analytics value - Wealth management concept.
Коллекция по умолчанию
Коллекция по умолчанию
Создать новую
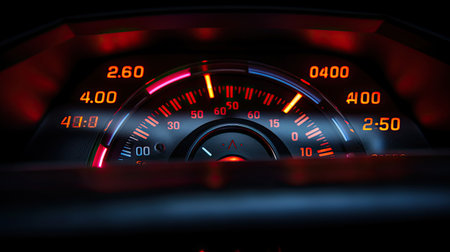
Speedometer ,Car speedometer and counter
Коллекция по умолчанию
Коллекция по умолчанию
Создать новую
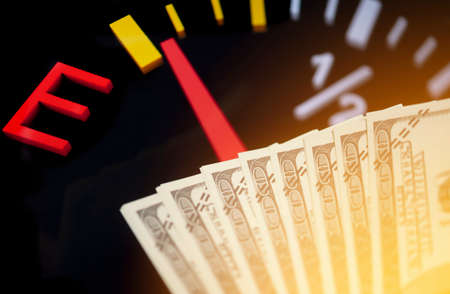
Dollar bank money coming from car fuel mileage dashboard concept closed on financial background
Коллекция по умолчанию
Коллекция по умолчанию
Создать новую
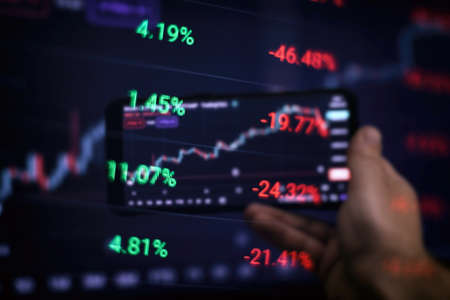
Business and trading finance contept. Stock exchange market chart view on smart phone screen.
Коллекция по умолчанию
Коллекция по умолчанию
Создать новую
Part of cars dashboard. Illuminated tachometer closeup. Black background.
Коллекция по умолчанию
Коллекция по умолчанию
Создать новую
February 23, 2021 Stock markets around the world continue sideways and declines. Investors continue to monitor. So as not to miss any investment opportunities
Коллекция по умолчанию
Коллекция по умолчанию
Создать новую
Abstract image of financial data and stock market analysis with colorful graphs and charts, representing economic trends and market fluctuations.
Коллекция по умолчанию
Коллекция по умолчанию
Создать новую
Closeup of a car dashboard in the sunlight
Коллекция по умолчанию
Коллекция по умолчанию
Создать новую

Dashboard with speedometer, tachometer, odometer. Car detailing. Car dashboard. Dashboard details with indication lamps.Car instrument panel.Modern interior.Close up shot.
Коллекция по умолчанию
Коллекция по умолчанию
Создать новую
A financial chart illustrates a notable surge in stock market profits, fueled by rising interest rates and consistent growth in money investments during recent months.
Коллекция по умолчанию
Коллекция по умолчанию
Создать новую

Vibrant candlestick patterns and descending trend lines illustrate a market downturn, highlighting analysis tools amid a somber financial atmosphere.
Коллекция по умолчанию
Коллекция по умолчанию
Создать новую
Close-up of illuminated speedometer display with red and white indicators. That the image is generated using AI.
Коллекция по умолчанию
Коллекция по умолчанию
Создать новую
business graph showing growth and success with dartboard
Коллекция по умолчанию
Коллекция по умолчанию
Создать новую
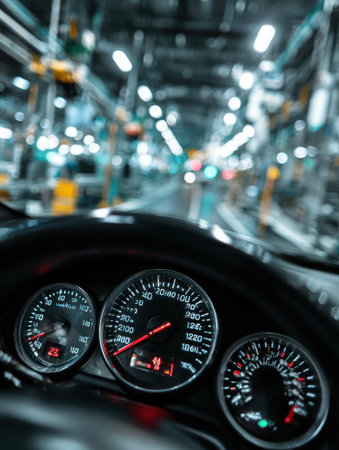
Automotive instruments, panels, speed concepts
Коллекция по умолчанию
Коллекция по умолчанию
Создать новую
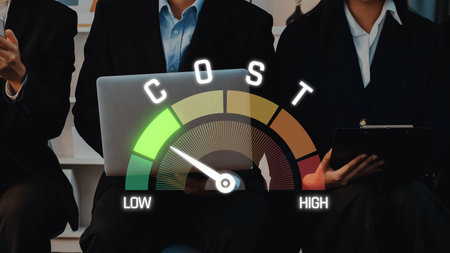
A cost assessment indicator showcases a low to high range on a laptop, while business professionals engage in discussion, exemplifying teamwork and analysis in a modern office. Raster
Коллекция по умолчанию
Коллекция по умолчанию
Создать новую

Wooden blocks displaying business growth icons, financial savings symbols, a target goal, the year 2026, representing future planning, economic strategy, investment forecasting, long-term objectives.
Коллекция по умолчанию
Коллекция по умолчанию
Создать новую

Treadmill console display screen showing exercise results in gym
Коллекция по умолчанию
Коллекция по умолчанию
Создать новую

Stockmarket online trading chart candlestick on crypto currency platform. Stock exchange financial market price candles graph data pattern analysis concept. Computer screen closeup background
Коллекция по умолчанию
Коллекция по умолчанию
Создать новую
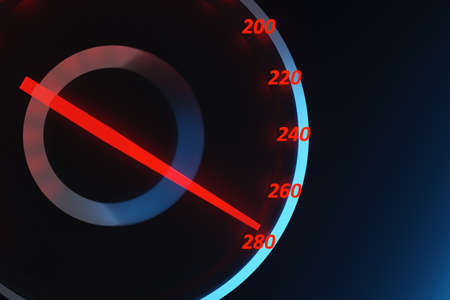
3D illustration close up black car panel, digital bright tachometer, Speedometer shows 280 km h. Speedometer arrow shows maximum speed
Коллекция по умолчанию
Коллекция по умолчанию
Создать новую
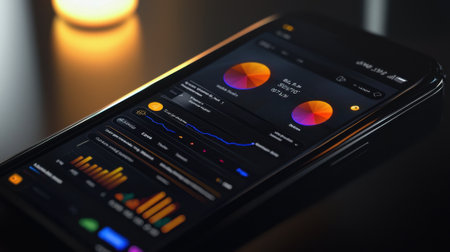
A modern smartphone showcases vibrant bar graphs and data visualizations against a dark background, perfect for illustrating business analytics and technological themes.
Коллекция по умолчанию
Коллекция по умолчанию
Создать новую
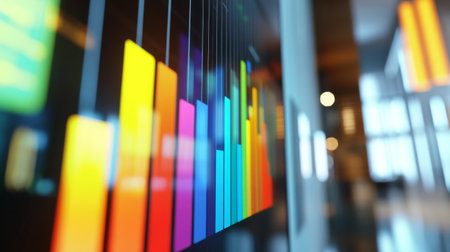
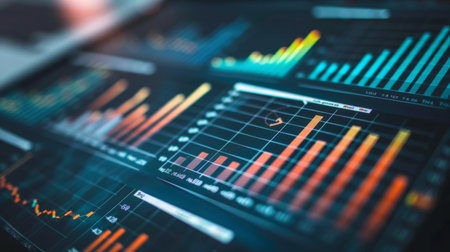
A close-up of a financial bar chart on a computer screen, showing different data categories with colorful bars, set in a modern office environment.
Коллекция по умолчанию
Коллекция по умолчанию
Создать новую
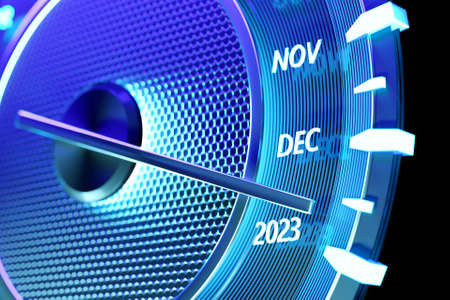
3D illustration close up black speedometer with cutoffs 2023 and calendar months. The concept of the new year and Christmas in the automotive field. Counting months, time until the new year
Коллекция по умолчанию
Коллекция по умолчанию
Создать новую
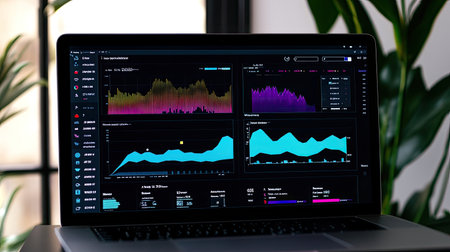
A sleek laptop shows a modern digital dashboard with colorful data visualizations and analytics, set in a contemporary workspace, perfect for business insights.
Коллекция по умолчанию
Коллекция по умолчанию
Создать новую

Speedometer in the car on the dashboard at night. Selective focus
Коллекция по умолчанию
Коллекция по умолчанию
Создать новую
Old car speedometer,odometer. Speed indicator background.Roration engine speed arrow.
Коллекция по умолчанию
Коллекция по умолчанию
Создать новую
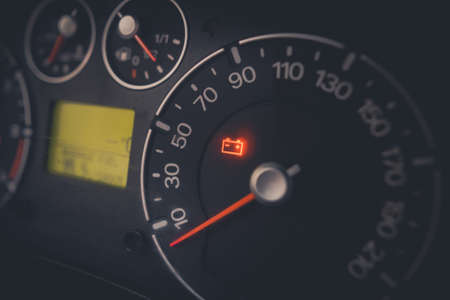
Close up shot of a car's dashboard with the battery icon lit.
Коллекция по умолчанию
Коллекция по умолчанию
Создать новую
A close-up of a financial report with multiple graphs and charts, showing data analysis.
Коллекция по умолчанию
Коллекция по умолчанию
Создать новую
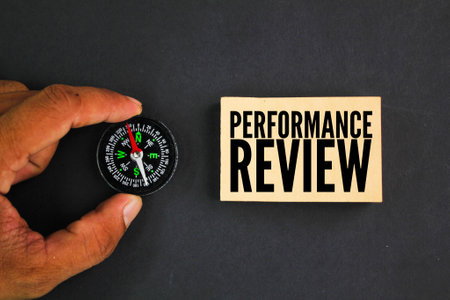
a compass and a square of paper with the word Performance review
Коллекция по умолчанию
Коллекция по умолчанию
Создать новую
Business and trading finance contept. Stock exchange market chart view on smart phone screen.
Коллекция по умолчанию
Коллекция по умолчанию
Создать новую
Financial Success Charts And Graphs Depict Booming Stock Market And Investments. Сoncept Financial Success, Stock Market, Investments, Charts And Graphs, Booming Economy.
Коллекция по умолчанию
Коллекция по умолчанию
Создать новую

hands showing music application on a smart phone
Коллекция по умолчанию
Коллекция по умолчанию
Создать новую

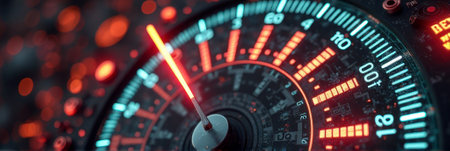
Car speedometer high performance and indicator sweeping to max power speed,dashboard car motion,double exposure automotive concept
Коллекция по умолчанию
Коллекция по умолчанию
Создать новую
Red arrow with a dial on a black background
Коллекция по умолчанию
Коллекция по умолчанию
Создать новую
Car dashboard
Коллекция по умолчанию
Коллекция по умолчанию
Создать новую

Abstract Financial Data Visualization, Blue Column Chart, Line Graph Overlays in Vibrant Colors
Коллекция по умолчанию
Коллекция по умолчанию
Создать новую
Stock market data on monitor. Business financial graph on monitor screen. Stock market data on monitor. Business financial graph on monitor.
Коллекция по умолчанию
Коллекция по умолчанию
Создать новую
Legion-Media
Создайте свои проекты на основе качественных стоковых фотографий и видео.


Copyright © Legion-Media.